
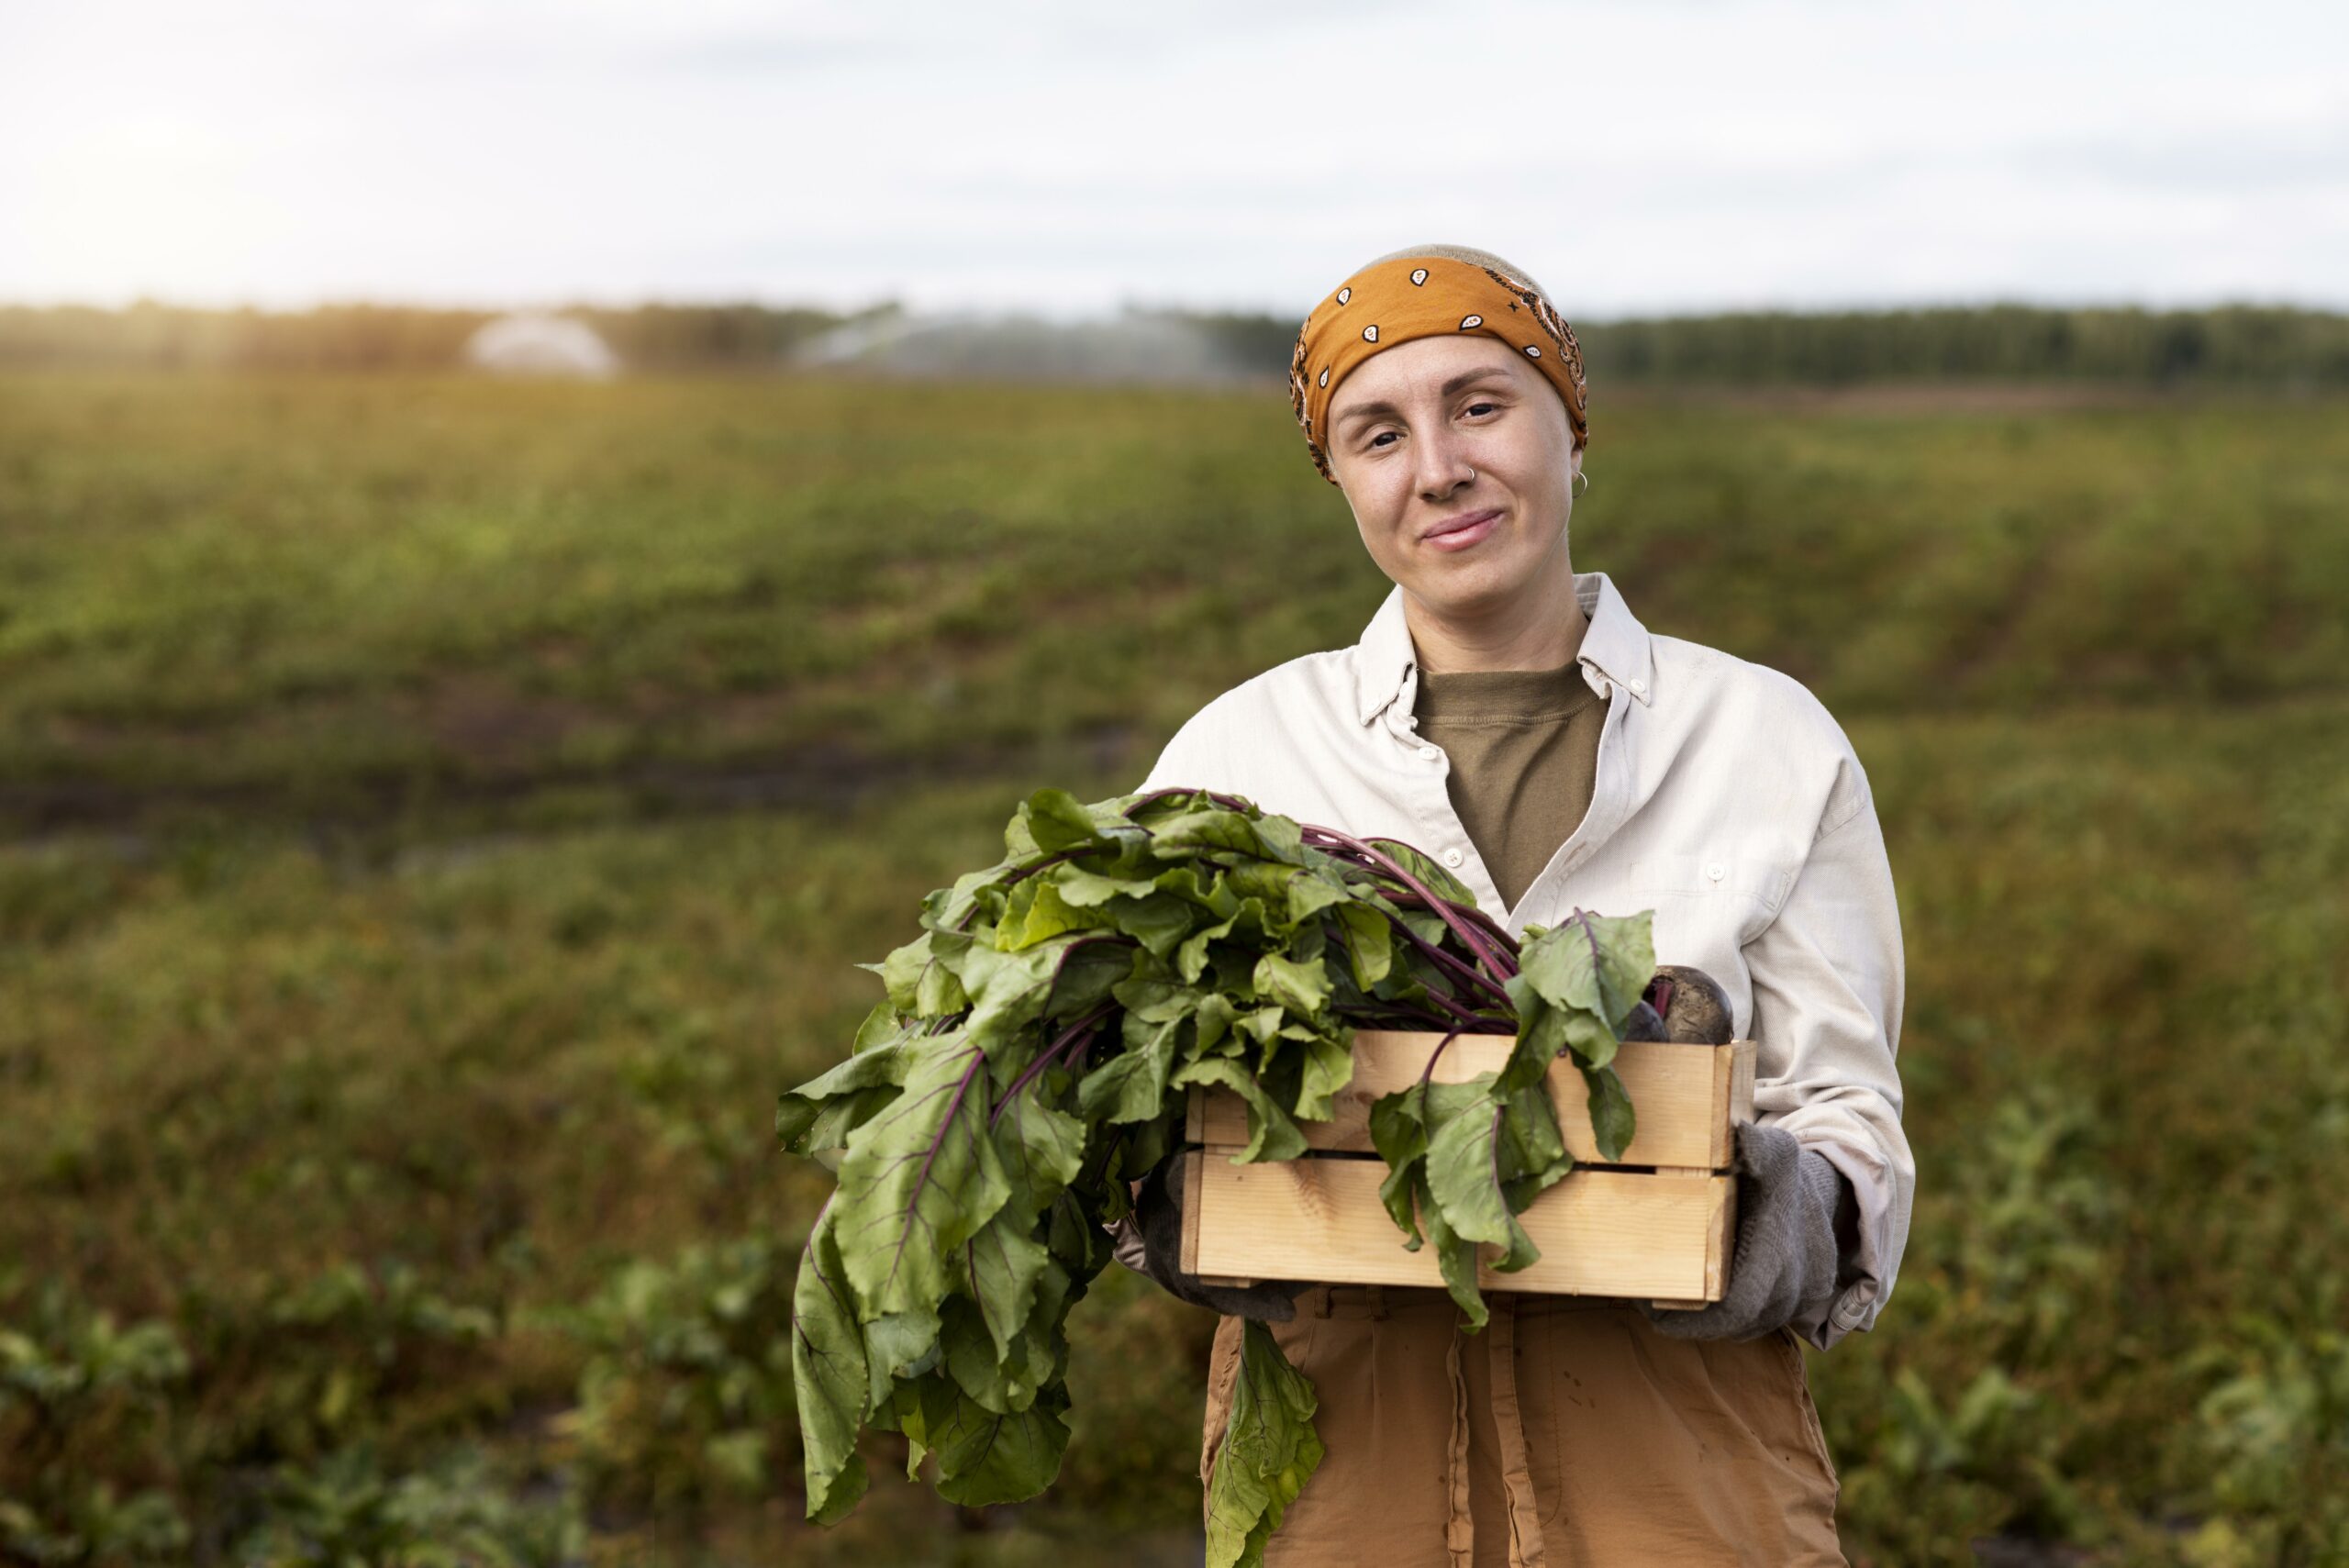
Ksapa has designed the SUTTI initiative and associated solutions to enable the transformation of the first mile of agricultural supply chains: we work with and for small farmers in medium and large scale programs, cooperating with industrial and financial actors, public authorities, civil society organizations or academics in several countries in Asia and Africa. For that purpose, we have designed a SUTTI digital suite enabling to disseminate content & information towards smallholders, but also to collect data from them in order to monitor our social, economic & environmental impact.
The issue of impact measurement and therefore the quality of impact data is key to the success of these projects:
- We need to monitor and evaluate the social, economic and environmental impact of our programs in order to ensure that they are useful and to be able to adjust our focus if the impact objectives we are pursuing are struggling to be achieved: access to quality vocational training and digitalization, income increase and diversification, social inclusion, impact on the carbon intensity of supply chains, etc.
- The types of coalitions organized around our programs require a materialization of the positive impact we bring, which will be the glue of these coalitions in the long term, while the stakeholders involved all have different goals and agendas. For example, we are working in Sri Lanka with the Sri Lankan and French governments, the Michelin Group, experts in various fields – agronomy, auditing, IT, legal advice, etc. – research institutes, universities, etc.
- Finally, even if the 600 million farms of less than 2 hectares provide a living for more than a quarter of humanity, it is clear that this part of the world’s population is a real black hole in terms of data, which is scarce, scattered and rarely comparable to establish and understand the profiles and functioning of small farmers, who are nonetheless totally essential to the world’s food supply and agro-industrial value chains.
For this reason, among others, we have designed the “SUTTI Digital Suite”, a digital solution in a hybrid format to support the face-to-face deployment of these programs:
- to disseminate content and information to participating small farmers – e-learning, information on prices or collection rounds, etc. -,
- but also to collect data from these same farmers – initial profile, P&L, geoplotting but also regular surveys
This solution is especially designed for complicated environments, with little access to recent terminals, limited connectivity or reading difficulties: thus, the SUTTI Digital Suite includes a multi-lingual farmer application, working on all types of phones (not only smartphones), working offline and usable by illiterate people.
It includes a back-office tool to administer the whole, but also a reporting tool to follow the progress of the program daily.
The SUTTI Data Committee
The difficulty of collecting data in a complicated environment is multiple:
- First of all, it is necessary to have the means to collect data not only at the level of the civil society organizations running these programs, but we have also chosen to collect them directly from small farmers, by developing our digital solutions. The participating farmers are naturally sensitized and trained to collect the data.
- But the data collected may contain inconsistencies, gaps, based on differences in interpretation or data entry errors, or even strategies to respond according to projected expectations
- This is even more difficult because data collected directly from so-called vulnerable populations is relatively rare and the methods for processing and interpreting it are lacking.
- Finally, to claim a positive social & environmental impact, three criteria must classically be met: intentionality, additionality and measurability. While some impact indicators are relatively easy to calculate, such as the number of people who had access to the program and reported not having had access to vocational training in the last five years, others are more complicated to measure or demonstrate. For example, monitoring changes in income alone cannot measure the additionality of our efforts: changes in income can come from the training provided or the resources provided in the program, but also from the increase in world prices, the negotiation capacities of farming communities, or the change in the margin taken by intermediaries in the supply chain. Thus, indicators that are truly representative of additionality should be included in the data collection: for example, the increase in yield as a result of changes in techniques or the provision of methods to control diseases in the plants and trees harvested, or the increase in income from crop diversifications promoted by the program.
Unevenly Collected Data Sources
With these principles in mind, we began collecting data, only to realize that the quality of the data was uneven and that some of the data was not usable, threatening to make the overall analysis meaningless.
Thus, missing or erroneous values (e.g. abnormal values which are impossibly large – for example, a sales price per kg representing 100 times the world’s commodity index) prevent the establishment of averages or correlations that would allow us to monitor the program’s impact in a meaningful way, depriving us of the means of analysis to adjust our actions. But these issues can potentially undermine our ability to report to different stakeholders (and especially to the funders of these programs) with a well-calibrated level of quality of impact indicators, which stakeholders should be able to rely on to guide their actions or communicate to their own stakeholders.
The experts of the SUTTI Data Committee
We have decided to strengthen our team’s data science capabilities, but also to add a Data Committee composed of professionals and experts in data science, to guide our choices and validate their scientific and operational logic.
This committee is composed of :
- Fatima Roudani, ESG & Impact specialist, who has been responsible for ESG big data issues in banking institutions
- Edwige Rey, Partner at Mazar and specialist in extra-financial auditing
- Nathan Hara, an astronomer specializing in the use of data to find exoplanets
They meet regularly to guide and validate our data science approach and its successful integration into our SUTTI solutions. In particular, it has allowed us to develop a 3-step approach, described below (improvement of data robustness, calculation of KPIs (Key Performance Indicators) on robust data, inference of impact from SUTTI Program to all data).
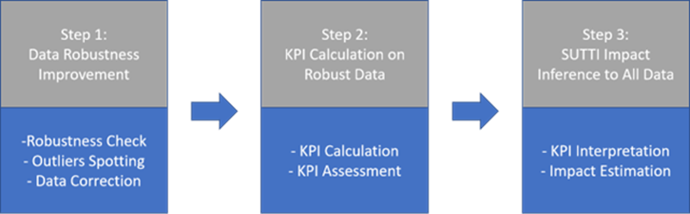
Step 1: Data Robustness Improvement
Data robustness improvement can be described as finding appropriate statistical methods or algorithms to spot those outliers, flag unusable or misleading data, and do data correction. In statistical term, an outlier is an observation that lies an abnormal distance from other values in a random sample from a population.
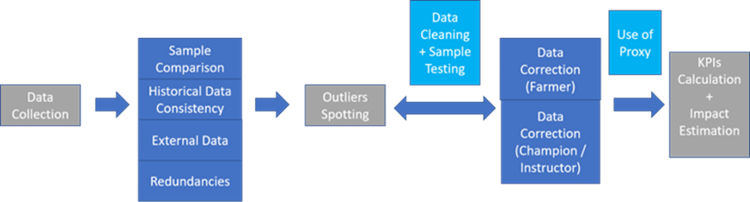
As for methods to spot outliers, we mainly have four types of outliers spotting methodologies or sources: historical data consistency, sample comparison, external data comparison, and data redundancy. The details of these methods can be described as follows:
(1) Historical data consistency. In this sense, normal data value should be under a reasonable range (neither too big nor too small) and outliers are those outside this range. Verification of historical data consistency is thus mainly based on density or distance. The most common way is the three-sigma rule: nearly all values should lie within standard deviations of the mean. Typically, if a farmer produces steadily x kg per month for 2 years, a monthly declaration x times higher than the usual range of declaration would be considered as a “data outlier”.
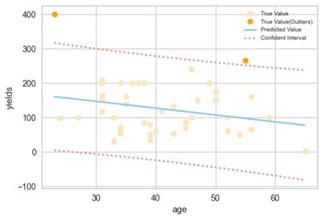
(2) Sample comparison. By using this approach, we study the relationship between targeted variable and other factors, and outliers are those that don’t follow the relationship. For instance, we have found a negative relationship between rubber yields and ages. By linear regression in the following picture, the dark orange points don’t follow this kind of relationship (based on the 95% confident intervals). Therefore, we mark them as suspected outliers: they represent data points differing significantly from average or usual range of a group of comparable farmer’s profile. It does not necessarily mean that they will be finally excluded from calculations, but they will be investigated with more caution.
(3) External data comparison. Several external data sources are under consideration: FAO, OECD, World Bank, UNESCAP, etc. For example, a particular farmer is likely (depending on the countries) to sell its production at a price ranging from 40 to 95% of world price (depending on location, country, …) – we use external data from gapkindo.com (Natural Rubber Price Watch in a few ASEAN countries provided by Indonesian institution Gap Kindo) to detect outliers for rubber prices in our Indonesian programs. Other similar calculations might be made as well on yield per Ha. According to this external data, we have found that the time series of the difference in rubber price (e.g., today’s rubber price minus yesterday’s rubber price) is stationary (stable) and we thus use ARIMA(1,1,1) (a classical time series model) to model the rubber price. Hence, we can use this ARIMA model to predict the rubber price on our own dataset, do the comparison between predictive values and real values, and outliers are thus those outside the confident intervals which are generated during the model fitting.
(4) Data redundancy. Data redundancy occurs when the same piece of data exists in multiple places. It usually happens when the design of the dataset is not appropriate. I can help spot some answerers whose answers can be inconsistent or unstable. Before we do the outliers spotting there is a need to check data redundancy and readjust database framework if necessary.
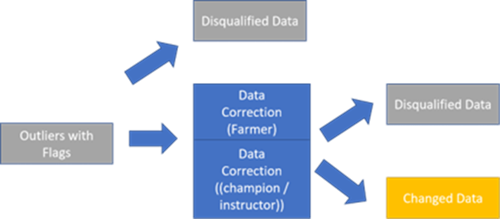
As for data correction, it is more likely to be done manually, either by farmers, champion farmers or instructors. As depicted in the following picture, it is unavoidable that only a part of outliers can be finally corrected, but this it enables to ensure that the Key Performance Indicators (KPIs) are thus only calculated on robust data (i.e., normal data with corrected outliers).
Step 2: KPI Calculation on Robust Data
Secondly, we calculate KPI on robust data. The design of KPIs mainly focuses on three aspects:
- We want to measure the number and composition of beneficiaries of SUTTI program and the type of public concerned. For example, the number of people reached (direct & indirect beneficiaries, % women, % youth…).
- We want to measure the access to professional training enabled by SUTTI programs. For example, the volume of professional training in hours/person (both in-person and digitally)
- Impact on increase and diversification of revenues
- Optional : carbon sequestration or GHG issuance avoidance
Hence, there are mainly 3 types of KPIs in SUTTI programs: participants’ number of SUTTI programs; professional training; impact on incomes of smallholder farmers. This approach is also adapted to carbon projects qualification & monitoring for example: carbon sequestered or GHG emissions avoided could be monitored through large-scale data collection directly from the hand of farmers and complemented by approaches like carbon account, satellite monitoring and so on.
For the first type (number of people reached), it includes all kinds of participants’ numbers counts, with different genders, ages, relatives, employments and so on. Examples: active participants count, direct beneficiaries count, number of people whose livelihood will be impacted, etc.
For the second type (volume of professional training), it mainly evaluates the training evolution, like training hours of the courses. Examples: in-person training hours, number of people accessing the capacity building on the SUTTI App, etc.
For the third type (impact on increase and diversification of revenues), several dimensions are under consideration.
As for the impact on revenues, the equation can be written as: revenues = yield × price × hectares. In this KPI, we want to know which part the increase of revenues comes from: yield, price or hectares, which exclude other variables that may also affect the revenues. Besides, it aims at measuring the relationship between revenue increase and diversity of farmers’ activities (potentially positive).
In this type, our program also considers the increase of productivity and diversification, including KPIs around crop production (maincrop yield, maincrop productivity, etc.), KPIs of crop protection (fertilizer use, pesticide use, medication intrant use, etc.), and KPIs of device information (browser, operation system, etc.).
Step 3: SUTTI Impact Inference to All Data
The need of impact inference comes from two reasons. On one hand, only farmer’s performance in SUTTI program is observable, whereas we are more interested in the general impact. On the other hand, only part of the outliers is finally corrected, and the KPIs are hence calculated on robust data.
In this case, we do the impact inference. The basic idea of impact inference is simple: we estimate the impact on sample data, based on some classical models (e.g., difference-in-difference model), then we make some adjustmentsaccording to the bias (e.g., introduce other variables into the model, or change the model structure). We can thus project estimated results based on sample data as the impact on all data. The equation estimated data on sample data is written as follows: estimated impact of SUTTI program = the actual value of KPI – the counterfactual value of KPI.
For example, suppose that in the data of SUTTI program, we have 1000 farmers and only the data of 600 farmers is robust. First, we do impact inference on those 600 farmers, and after calculation, we notice that their average income increase is 1000 dollars per month. Then we realize that these farmers are younger compared with all data, and younger farmers are easier to accept new technology. So we do some adjustments, and the final estimated impact on farmer’s income is 800 dollars per month of increase.
In our case, the counterfactual value can be interpretated as the value that KPI will have if there is no SUTTI program. Apparently, the counterfactual value of KPI is not observable and statistical models are thus needed to “predict” them. In this case, two methods are commonly used: differencein-differences (DiD) and discontinuity. When we design the impact inference model, the keys are the introduction of control variables and the solutions of selection bias. The model includes control variables because those variables are those that may also have an influence on the outcome variables (KPIs). For example, we introduce ages and genders as control variables when we estimate SUTTI impact on maincrop productivity. Undoubtedly, the more related control variables we introduce, the estimated impact will be more accurate.
And as for the selection bias, it is the bias that results from the failure to ensure the proper randomization of a sampled population, like self-selection, survivorship bias, pre-screening of participants, etc. In any case, the most radical solution is to know how does the exact selection bias look like in the dataset and so we can adjust it in the estimation model.
Conclusion
In conclusion, we believe that it is essential to collect impact data from the beneficiaries themselves, and that the digital solutions we have developed make it possible to collect this data, even under difficult access conditions. Coupled with other modes of collection by instructors, they allow us to collect statements and opinions from program beneficiaries, thus filling gaps in data on vulnerable populations as well as documenting the measurement of impact on our programs. The data science approaches developed under the supervision of our Data Committee make it possible to process significant amounts of data and to derive in-depth analyses and impact projections that are widely applicable outside the agricultural field for which they were designed: for example, these solutions can also be applied to mass studies on issues of decent income or working conditions for workers
20+ years of experience in investment & asset management.
Raphael Hara works on relationships between finance and sustainability, in particular through the development and management of impact investment funds and projects.


Xianlin Ding
Xianlin works as a Data Analyst at Ksapa. Among other things, he manages and analyses the data collected from agricultural populations via the SUTTI application, as well as the implementation of impact monitoring systems and indicators.
Xianlin is a student of both ENSAE Paris in Data Sciences and Social Sciences and Sciences Po Paris in International Economic Policy. He has already worked in applied statistics (GDP estimation in China, real estate price forecasting in Japan...). He has previously analysed data from “European Societies” to bring out the valued elements of the journal.
Xianlin speaks Mandarin, English, French and Spanish.